Jonathan Akins, MS, Patricia Karg, MS, and David Brienza, PhD
Support Surface Laboratory – University of Pittsburgh Pittsburgh, PA
ABSTRACT
Subcutaneous buttock soft tissues were investigated using a finite element model. Researchers have previously used finite element models, however, this study improved upon image collection methodology and validation techniques. Magnetic resonance (MR) images of one subject were collected in three seated postures and were used to create 3-D models of the buttock. A non-linear 3-D finite element model was developed with anatomical geometries using hyperelastic and viscoelastic constitutive models. Interface pressure, interface shear stress, and soft tissue displacements were used to validate the model. A parametric analysis resulted in a partially validated model that provided subcutaneous stresses and strains for the upright-seated posture. The validated model will be the basis for future studies evaluating the SCI population and commercial and prototype wheelchair seat cushions.
KEYWORDS
pressure ulcers; buttock tissue; finite element; magnetic resonance imaging
BACKGROUND
Prediction of subcutaneous stress and strain distribution is necessary in the absence of a noninvasive methodology. Previous researchers have used finite element models to investigate the subcutaneous tissue response to mechanical loading (1-10). Finite element models have evolved from simplistic geometric shapes and linear material properties to a sound methodology of capturing subject-specific geometry and using non-linear material properties to estimate subcutaneous stresses and strains (4-6). Limitations of recent studies include image collection methodology, model construction, and validation. The objective of this study was to quantify subcutaneous buttock tissue stresses and strains using a finite element (FE) model.
METHODS
One healthy, 35 year old male was the single subject in this study. All procedures were approved by the institutional review board and written informed consent was obtained prior to screening and experimental procedures. MR images of the subject were collected in an UprightTM MRI (FONAR Corp., Melville, NY, USA). An interface pressure sensor array (FSA, Vista Medical, Winnipeg, Manitoba, Canada) was used to measure interface pressure at the cushion interface and a shear force sensor (36 x 66 mm; Predia, Molten Corp., Japan) was used to measure interface shear stress at the cushion interface.
Image Collection

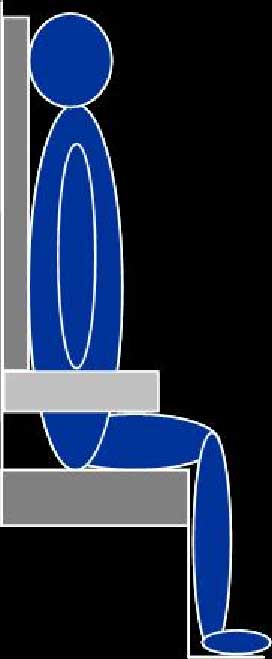

Figure 1: Sitting postures for MRI data collection (Click for larger view)
Sagittal MR images of the left buttock were collected in three seated postures (SP): non-loaded; upright; and reclined as shown in Figure 1. The non-loaded-SP orientated the subject into a supine position while maintaining a SP with a trunk angle of 90° with respect to the thigh, the upright-SP orientated the subject into a typical seated position with a trunk angle of 90°, and the reclined-SP orientated the subject into a SP with a trunk angle of 120°. The reclined-SP provided a shear induced posture to identify the effects of shear on subcutaneous tissues. After MR image collection, the interface pressure sensor array was placed in between the subject and cushion and the interface shear force sensor was placed inferior to the left ischial tuberosity (IT) by palpation. The subject was positioned into each posture as shown in Figure 1 and measurements were recorded after 60 seconds. The subject sat on an HR45 open-cell polyurethane foam cushion (16”x16”x3”) for all postures.
Model Construction
The 3-D FE model was constructed using geometry from MR images. The non-loaded, upright, and reclined slices that corresponded with maximal compression of soft tissue between the IT and cushion were chosen for model construction. The corresponding images were digitized to obtain the 3-D model based on a previously published method (4, 5).
Bone tissue was assumed rigid and soft tissues were assumed incompressible, non-linear materials which undergo stress relaxation. The incompressible, non-linear behavior of the soft tissues was described by a Neo-Hookean hyperelastic constitutive model and the polyurethane cushion was described by a first-order Ogden hyperelastic constitutive model. The stress relaxation behavior (viscoelasticity) of the soft tissues was described by the Prony series expansion (11). Hyperelastic and viscoelastic material parameters were determined based on values in the literature (1, 4, 11, 12). A Coulomb friction model was applied at the contact surface between the skin/inferior adipose tissue layer and cushion with a coefficient of friction of 0.5.
Boundary conditions were used to constrain the model and apply IT displacement and pelvic rotation. A fixed support was applied to the inferior surface of the cushion and the distal surfaces of the skin/inferior adipose tissue and anterior muscle group. All other surfaces were free to move in superior-inferior and anterior-posterior planes, but constrained in the sagittal plane. The upright-SP was modeled using IT displacement and the reclined-SP was modeled using pelvic rotation. Ischial tuberosity displacement was applied to IT surfaces and pelvic rotation was applied about the center of the femoral head. The FE model was solved using ANSYS and the solutions provided stress and strain distributions. Large displacements were accounted for in the models.
Model Validation
The FE model solutions were validated using interface pressure measurements, interface shear stress measurements, and comparing soft tissue displacements. Interface pressure and shear stress measurements were recorded using an interface pressure sensor array and shear force sensor, respectively, and compared to predicted principal compressive stresses along the cushion surface of the FE model. Predicted soft tissue displacements from the FE model were compared to the MR images using a method described by Makhsous et al (6). The difference between the measured and predicted soft tissue displacements were calculated for the upright and reclined-SPs. Model validation criterion was established as a difference less than 10% between measured and predicted values.
Parametric Analysis
A parametric analysis was performed on material parameters of the upright-SP model to increase the agreement between the measured and predicted interface stresses and soft tissue displacements. The material parameters used in previous studies were ‘fine tuned’ or not stated, making material parameter selection and adjustment difficult (4-6). Muscle, adipose and cushion material parameters were varied, resulting in seven model variations from the Reference Model.
Subcutaneous Tissue Stresses and Strains
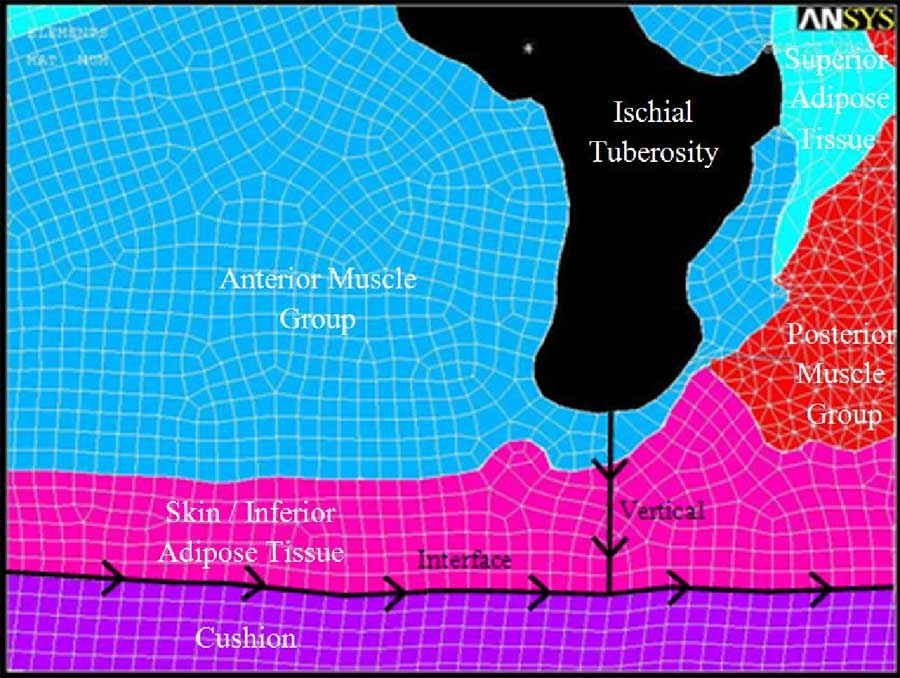
Figure 2: Mesh of subject-specific buttock geometry with segments and paths labeled (Click for larger view)
Principal compressive stresses and strains were evaluated along a vertical path from the inferior tip of the IT to the cushion surface. The path was attached to the nodes located at the IT and cushion. The resulting stresses and strains were calculated along the path, which included the anterior muscle and skin/inferior adipose tissue. Principal compressive stresses were mapped to the vertical path from the inferior tip of the IT to the cushion surface and are shown in Figure 2.
RESULTS
Model Validation
Interface pressure was measured and predicted along the cushion interface as shown in Figure 2. Principal compressive stress was used to predict interface pressure. For the upright-SP, measured and predicted interface pressures at the IT were 86.5 and 58.6 mmHg, respectively. For the reclined-SP, measured and predicted interface pressures at the IT were 75.2 and 78.1 mmHg, respectively. The measured interface pressure for the upright-SP resulted in an even distribution across the cushion; however, the predicted was not evenly distributed.
Interface shear stress was measured inferior to the left IT and predicted along the cushion interface as shown in Figure 2. In the upright-SP, the predicted interface shear stress was 0.3 kPa compared to 1.8 kPa measured. In the reclined-SP, the predicted interface shear stress was 2.6 kPa compared to 0.7 kPa measured. The model predicted greater interface shear stress in the reclined-SP, but greater interface shear stress was measured in the upright-SP.
Agreement between measured and predicted soft tissue displacement was greater for the upright-SP as compared to the reclined-SP. The least amount of discrepancy between the measured and predicted displacements occurred just posterior to the IT and increased anteriorly.
Parametric Analysis
One variation (Rev 3) from the Reference Model resulted in the greatest agreement for interface pressure, interface shear stress, and soft tissue displacement. The Rev 3 model was validated for interface pressure and soft tissue displacement, but not for interface shear stress. Results for the Reference Model and Rev 3 Model are reported (Figure 3). The Reference Model was not validated and the results are reported for informational purpose only. The Rev 3 Model results were partially validated (upright-SP) and should be interpreted as estimated subcutaneous tissue stresses and strains.
Subcutaneous Tissue Stresses and Strains
Principal compressive stress distributions for the upright and reclined Reference Model are illustrated in Figure 3a. Peak principal compressive stress for the upright-SP was 11.7 kPa at the IT. Stress decreased through the muscle and adipose tissues to a value of 7.3 kPa. Peak principal stress for the reclined-SP was 25.7 kPa at the IT. Stress decreased through the muscle and adipose tissues to a value of 10.4 kPa.
Principal compressive strain distributions for the upright and reclined Reference Model are illustrated in Figure 3b. For the upright-SP, principal compressive strain increased through the muscle tissue and peaked near the adipose tissue (0.42). A sharp decrease in strain occurred at muscle-adipose tissue border followed by a small decrease through the adipose tissue. For the reclined-SP, strain peaked at the IT (1.12) and decreased through the muscle tissue. Strain decreased sharply at the muscle-adipose tissue border and changed slightly through the adipose tissue.
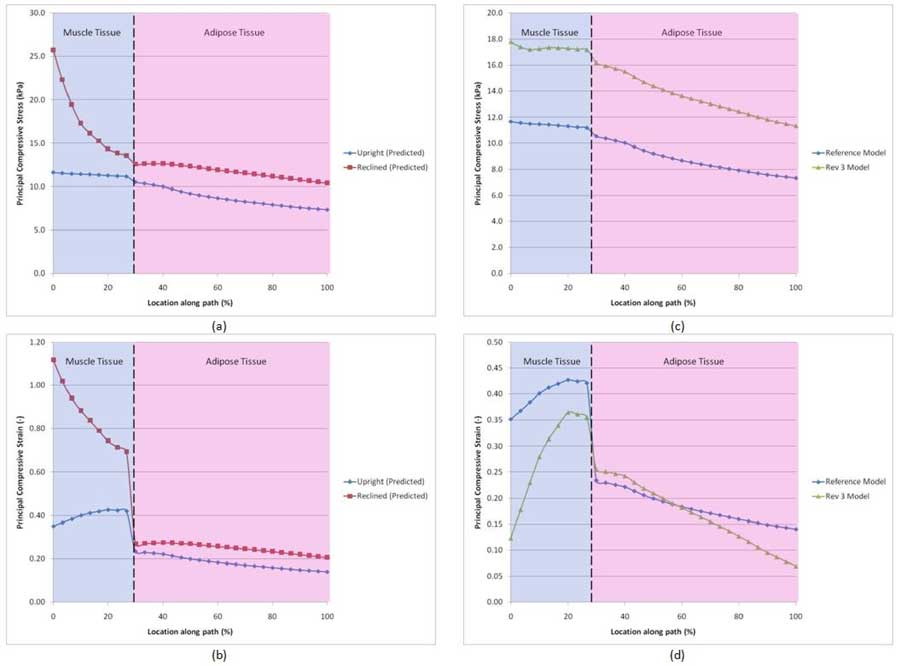
Principal compressive stresses from the inferior tip of the IT to the cushion surface for the Reference and Rev 3 upright models are shown in Figure 3c. Peak principal compressive stress for both models occurred just inferior to the tip of the IT. Decreasing the material incompressibility parameter of the muscle and adipose tissue in model Rev 3 resulted in an increase in peak compressive stress from 11.7 to 17.8 kPa and a greater decrease in compressive stress through the adipose tissue to a value of 11.3 kPa.
A large difference in the compressive strain at the IT was present between the Reference and Rev 3 upright models as shown in Figure 3d. Through the muscle tissue, Rev 3 increased at a greater rate, but the peak compressive strain (0.36) was less than the Reference Model (0.43). Rev 3 also resulted in a greater rate of change through the adipose tissue, crossing the Reference Model at approximately 60%.
DISCUSSION
Previous authors only compared measured and predicted interface pressures at the IT (4-6). Similar interface pressures at a single point were obtained in this study; however, the predicted interface pressure distribution was not similar to the measured distribution. A possible explanation for the difference was tissue mass. Tissue masses were not included in the model and could increase the agreement between measured and predicted interface pressure distribution. Interface pressures from this study were slightly lower than the data reported by Linder-Ganz et al (4, 5). A possible explanation for lower subcutaneous stresses and strains from this study was due to the cushion model. The support surface modeled in this study provided a ‘soft’ surface to distribute the loads as opposed to a rigid, fixed support used by Linder-Ganz et al (4, 5).
The reclined-SP was not validated for this study because soft tissue displacements were outside the validation criteria. In a reclined posture, the sacrum supports the majority of the mass instead of the IT and the FE model did not account load shift as the pelvis rotated. Therefore, future models should create a full 3-D model using the subject-specific geometry that would include the sacrum.
An image marker was not used during image collection. An image marker would have provided a known location in the images collected for the three postures. Because an image marker was not used, the author made the assumption of only vertical displacement of the IT for the upright-SP and pelvic rotation about the center of the femoral head for the reclined-SP. While the assumptions were logical and provided subcutaneous tissues stresses in the upright-SP, the assumptions did not accurately describe pelvic movement. Additional information on this study is available (13).
REFERENCES
- Dabnichki, P.A., A.D. Crocombe, and S.C. Hughes, Deformation and stress analysis of supported buttock contact. Proceedings of the Institution of Mechanical Engineers. Part H, Journal of engineering in medicine, 1994. 208(1): p. 9-17.
- Gefen, A., et al., In Vivo Muscle Stiffening Under Bone Compression Promotes Deep Pressure Sores. Journal of Biomechanical Engineering, 2005. 127: p. 512-524.
- Lim, D., et al., Evaluation of a new sitting concept designed for prevention of pressure ulcer on the buttock using finite element analysis. Med Biol Eng Comput, 2007.
- Linder-Ganz, E., et al., Assessment of mechanical conditions in sub-dermal tissues during sitting: A combined experimental-MRI and finite element approach. Journal of Biomechanics, 2007. 40(7): p. 1443-1454.
- Linder-Ganz, E., et al., Strains and stresses in sub-dermal tissues of the buttocks are greater in paraplegics than in healthy during sitting. Journal of Biomechanics, 2008. 41(3): p. 567-580.
- Makhsous, M., et al., Finite Element Analysis for Evaluation of Pressure Ulcer on the Buttock: Development and Validation. IEEE Transactions on Neural Systems and Rehabilitation Engineering, 2007. 15(4): p. 517-525.
- Oomens, C.W.J., et al., Can Loaded Interface Characteristics Influence Strain Distributions in Muscle Adjacent to Bony Prominences? Computer Methods in Biomechanics and Biomedical Engineering, 2003. 6(3): p. 171-180.
- Ragan, R., et al., Seat-interface pressures on various thicknesses of foam wheelchair cushions: A finite modeling approach. Archives of Physical Medicine and Rehabilitation, 2002. 83(6): p. 872-875.
- Sun, Q., et al., Finite element modeling of human buttock thigh tissue in a seated posture. 2005 Summer Bioengineering Conference, June, 2005: p. 22-26.
- Todd, B.A. and J.G. Thacker, Three-dimensional computer model of the human buttocks, in vivo. J Rehabil Res Dev, 1994. 31(2): p. 111-119.
- Bosboom, E.M.H., et al., Passive transverse mechanical properties of skeletal muscle under in vivo compression. Journal of Biomechanics, 2001. 34(10): p. 1365-1368.
- Palevski, A., et al., Stress Relaxation of Porcine Gluteus Muscle Subjected to Sudden Transverse Deformation as Related to Pressure Sore Modeling. Journal of Biomechanical Engineering, 2006. 128: p. 782.
- Akins, J.S., Investigation of interface shear stresses on wheelchair seat cushions and the effects on subcutaneous buttock tissues, in Bioengineering. 2008, University of Pittsburgh: Pittsburgh. p. 1-126.
ACKNOWLEDGEMENTS
This work was funded by the National Institute on Disability and Rehabilitation Research (NIDRR), Rehabilitation Engineering Research Center (RERC) on Spinal Cord Injury, Grant #H133E070024. This work was also funded in part under The Technology Collaborative (TTC), Grant # 705244. The ideas and opinions expressed herein are those of the authors and not necessarily reflective of the NIDRR and TTC. We also thank FONAR Corporation (Melville, NY) for use of their facility.
Author Contact Information
Jonathan Akins, BS, University of Pittsburgh, 2310 Jane Street Suite 1300, Pittsburgh, PA 15203, Office Phone (412) 586-6905, EMAIL: jsa14@pitt.edu